West Coast Paper: A Small Capitalization Stock with Promising Potential
Investing in the stock market can be a daunting task, especially when it comes to identifying opportunities in small capitalization stocks. However, West Coast Paper, with a current market price of INR 640 and a market capitalization of INR 4233 crores, stands out as an intriguing option for investors looking for potential growth. In this article, we will delve into the key financial indicators and market trends surrounding West Coast Paper to provide a comprehensive analysis of its investment potential.
Financial Indicators and Ratios
When evaluating a stock, it is crucial to assess various financial indicators and ratios to gauge its financial health and performance. West Coast Paper boasts impressive figures in several key areas:
- 5-Year Median EV Multiple: With a median EV multiple of 3.7 over the past five years, West Coast Paper demonstrates consistent valuation stability.
- Current EV Multiple: The current EV multiple of 2.8 suggests that the stock is currently undervalued, potentially presenting an attractive buying opportunity.
- P/B Ratio: The P/B ratio of 1.43 indicates that West Coast Paper is trading at a reasonable price in relation to its book value.
- ROCE: With a remarkable ROCE of 52.9%, West Coast Paper showcases its ability to generate substantial returns on capital employed.
- OPM (TTM): The operating profit margin of 30% reflects the company’s efficient cost management and profitability.
- Debt/Equity Ratio: West Coast Paper maintains a low debt/equity ratio of 0.04, indicating a healthy balance sheet and reduced financial risk.
- Promoter Holding: With a promoter holding of 56.9%, West Coast Paper demonstrates the confidence and commitment of its key stakeholders.
- Compounded Sales and Profit Growth: Over the past three years, West Coast Paper has achieved an impressive compounded sales growth of 25% and a compounded profit growth of 37%, highlighting its consistent upward trajectory.
Market Trends and Technical Analysis
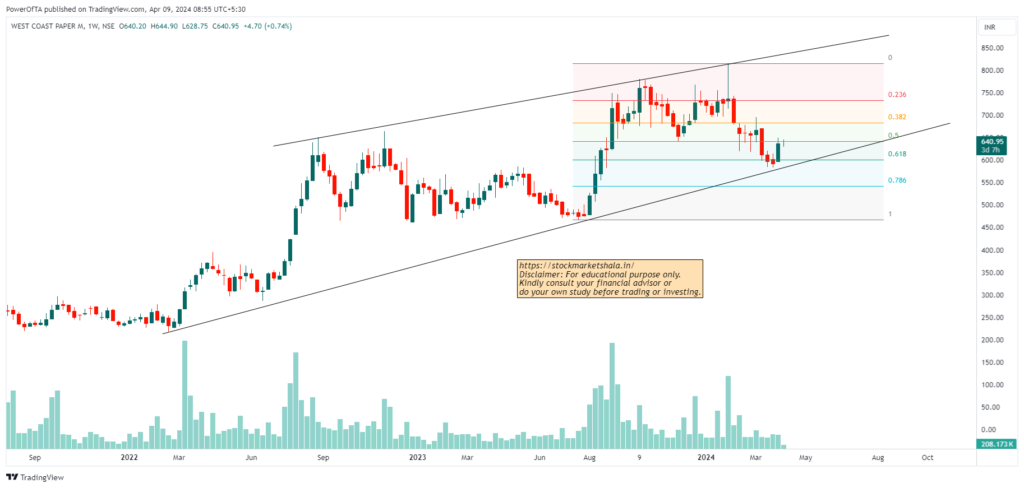
Examining market trends and conducting technical analysis is essential for understanding the future prospects of a stock. In the case of West Coast Paper, the weekly chart reveals some interesting patterns and levels:
- Fibonacci Swing Low and High: On 24-07-2023, West Coast Paper recorded a Fibonacci swing low of INR 462, while on 29-01-2024, it reached a Fibonacci swing high of INR 815. These levels provide valuable insights into potential support and resistance levels.
- Fibonacci 0.618 Golden Ratio: The Fibonacci 0.618 golden ratio stands at INR 599, acting as a crucial level to monitor. If the stock price falls below this level, it may indicate a further decline in price.
- Price and Volume Trends: Since January 2024, West Coast Paper has experienced a downward trend in price, accompanied by declining volumes. This suggests a potential trend reversal from downtrend to uptrend. The price is has fallen with low volumes exhibiting a potential exhaustion of selling and a possibility of trend reversal.
- Higher High and Higher Low Pattern: The weekly chart illustrates a higher high and higher low price pattern, indicating a positive trend. However, investors should closely monitor future price movements to confirm the sustainability of this pattern.

Conclusion
West Coast Paper emerges as an intriguing investment opportunity in the small capitalization stock market. With its impressive financial indicators, including a low EV multiple, attractive P/B ratio, and strong ROCE, the stock showcases its potential for growth and profitability. Furthermore, the market trends and technical analysis suggest both support and caution, emphasizing the importance of thorough research and monitoring.
Investors should approach West Coast Paper with a long-term perspective, considering its compounded sales and profit growth over the past three years. While the current market price of INR 640 presents an entry point, it is essential to evaluate market conditions and consider risk factors before making an investment decision.
Disclaimer: The information provided in this article is for educational purposes only and should not be considered as financial advice. Investors are advised to conduct their own research and consult with a qualified financial advisor before making any investment decisions.
Join the upcoming Price Action Simplified course starting from 27 April, 2024, with 3 months of mentorship support. Limited seats are available, so visit www.rajneeshduaclasses.com


