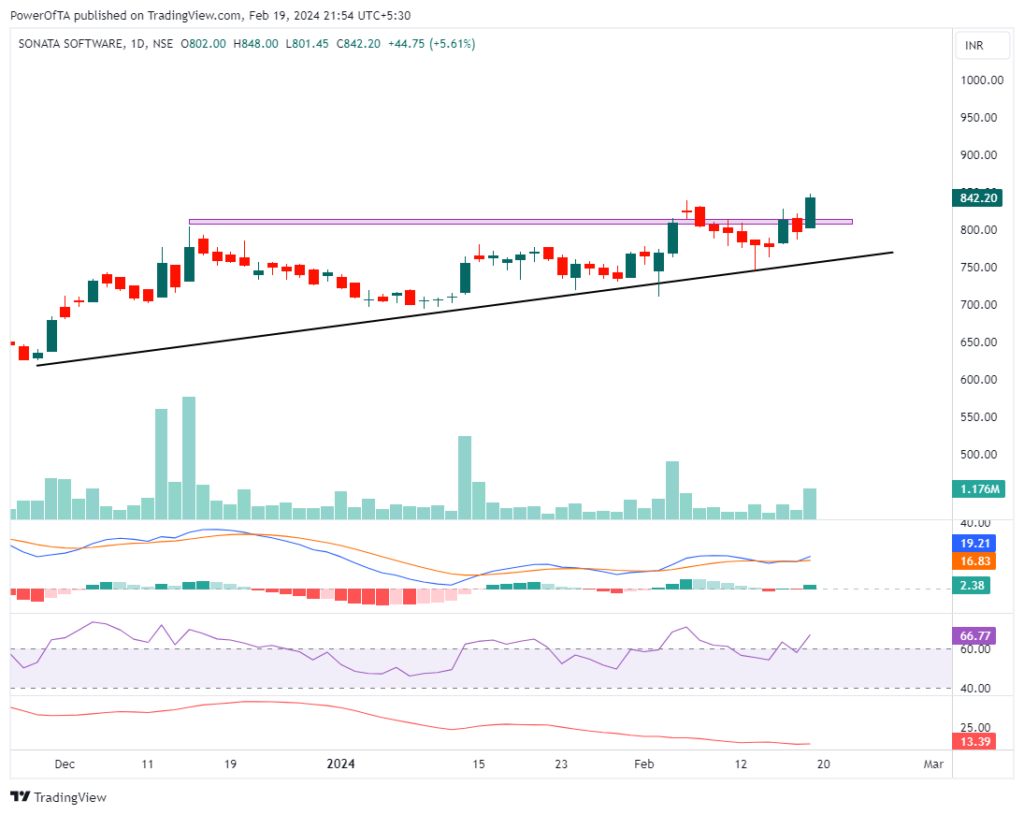
Sonata Software Limited (CMP 842) has been making waves in the stock market lately, drawing attention from investors seeking opportunities in the IT sector. Today, we delve into the technical analysis of Sonata Software, focusing on its daily timeframe chart to identify potential trends and opportunities.
Pattern Recognition: An ascending triangle pattern has formed on the chart, characterized by a series of higher lows and a horizontal resistance level. This pattern suggests a period of consolidation followed by a potential breakout to the upside. Traders often anticipate bullish momentum upon the breakout of such patterns.
Confirmation Indicators: The Relative Strength Index (RSI) is above 60, indicating strong momentum in Sonata Software’s price movement. RSI readings above this threshold are typically interpreted as bullish signals, suggesting further upside potential.
Trend Strength: However, it’s essential to consider other factors influencing the stock’s trajectory. The Average Directional Index (ADX) is at 13, signaling a weak trend. While bullish indicators are present, the overall trend strength appears to be moderate, requiring cautious interpretation.
Conclusion: In conclusion, Sonata Software presents an intriguing opportunity for traders and investors alike, with various bullish indicators suggesting potential upside momentum. However, it’s crucial to remain vigilant and consider the broader market context before making any investment decisions.

Remember, this analysis serves as an educational tool and should not be construed as financial advice. Always conduct thorough research and consult with a qualified financial advisor before executing any trades or investments.
Disclaimer: The above analysis is for educational purposes only and should not be considered financial advice. Investing in the stock market carries inherent risks, and individuals should conduct their own research or consult with a financial advisor before making any investment decisions.


